Use a graphical input to add a graph to your model.
You can use the graph to display whatever variables you want, in a way that may be more explanatory than a list of numbers.
To place a graphical input on the diagram
- From the Interface Build toolbar, click on the graphical input
 tool.
tool.
- Click the diagram to add the graphical input.
- Position the graph, and change its size and shape using the handles or the Style Settings tab of the Properties panel.
- In the properties panel, choose the variable you'd like to graph.
- If you want to, give your graph a title. You can change the text style in the Style Settings tab, where you can also change the color of the graph's border.
- Run the model, and the variable will graph onto your graphical input.
Graphical Input Properties
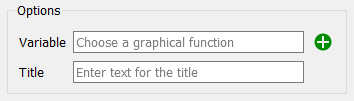
Variable specifies the variable(s) that will be displayed on the graph.
Title specifies what title will be displayed under the graph.