A sketchable graph contains both the plot of a model variable and a sketchable plot that the user can update. Sketchables are very useful for putting in expectations about results and then simulating to compare the actual outcomes of the simulation to those expectations.
A sketchable graph allows model users to "sketch out" their goal or expectation of the performance for a single variable against the variable's actual performance over a simulation run.
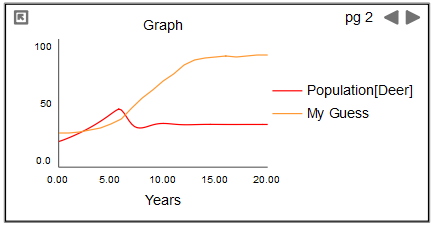
When you create a sketchable graph, the graph displays two curves: the actual performance of the variable (shown in the following example as a red curve), along with the user-created sketch of the curve for that variable (shown as an orange curve).
You and your model users can now create the sketch by clicking inside the graph and dragging, to draw the desired curve. When the model simulation runs, the actual curve appears on that graph along with the sketch.
It's not necessary to include a variable in a sketchable graph. You can include only the graphical function being sketched; in this way, the sketchable becomes an input device analogous to the knobs that are displayed in Explore mode. As you change the graph, the model will be simulated each time you release the mouse button, and you can instantly see the results of the change made.