The results panel lets you see graphs of results from the model simulations you've made. To open it:
From the Model menu, select Open Results panel
or
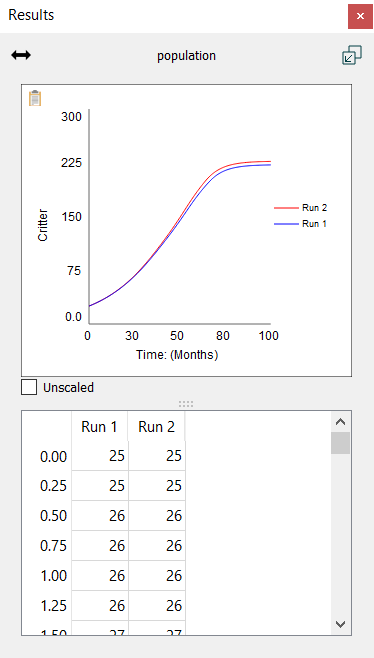
The results panel will open:
Unscaled, if checked, will cause the graph to display without trying to round the vertical scale. This is very helpful when looking at variables that have small variations over the course of a run.
The results panel displays comparative graphs for any variable you select. You can also set it to display only the most recent run in the Model Settings Properties Panel.
You can set constant values in the results panel, as long as Show inputs in Results panel is checked in the Preferences Dialog and you're in Explore mode. When you select a constant, the panel will display an entry for the value.
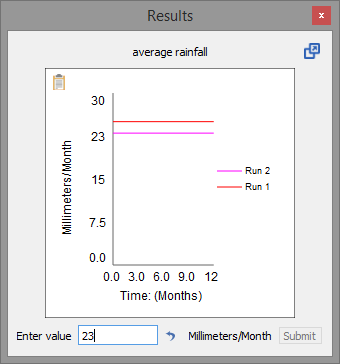
To change the value, type in a new value and click the Submit button (or press the enter key). To reset the value to the model equation value, click on the ![]() button.
button.