Use the Graph Settings Properties panel to control the appearance of graphs in the model. These setting can be overridden for individual graphs except as noted.
To open the Model Settings, switch to Edit mode and click on an empty space in the model. (If you've closed the Properties panel, you'll need to double-click, or slide it out with the ![]() button appearing at the right of the application.) Then click on the
button appearing at the right of the application.) Then click on the ![]() tab at the bottom of the panel.
tab at the bottom of the panel.
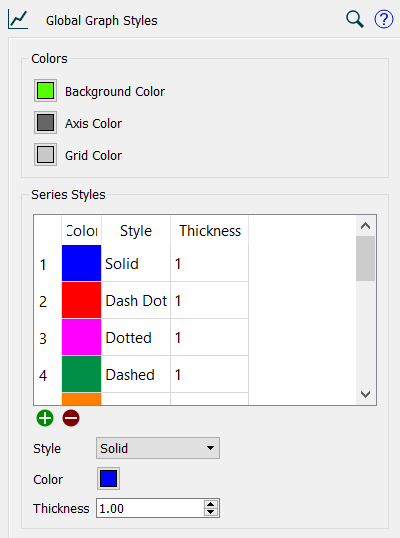
Use the series styles to control the color, line style and thickness for graph lines. As you add variables to the graph they will use the next one in the sequence (starting again at the beginning if the sequence is used up). That appearance can be changed for each series, but comparative graphs will always use the sequence defined in this panel.
To change a series style, click on the series style you want to change, then set the Style, Color and Thickness. You can delete a series using the ![]() button and add a series using the
button and add a series using the ![]() button.
button.
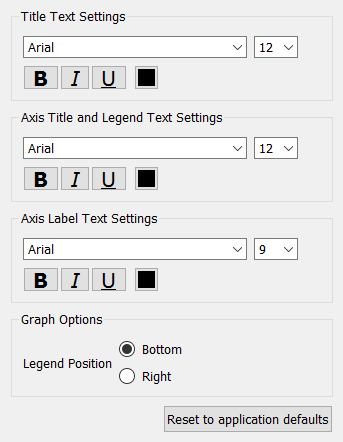
Use this to set the font size, face and attributes for graph values. Select the face and points size from the dropdowns. Click on B for bold, I for italic and U for underline, click again to toggle off. Click on the color button to select a color.
Specifies the text appearing in the title (at the top) of the graph.
Specifies the text appearing in the axis titles (left, below, right) and legend (below or right).
Specifies the text that labels the scales along the x and y axes.
Specifies the position of the legend. Select bottom or right.
Reset
Replace all values for the model with those from the