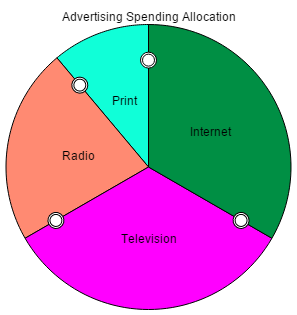
The allocation input is used to set values that need to add up to a constant, so that increasing one must decrease the others. It's implemented as a pie chart, and the size of the different pie slices can be adjusted by dragging the boundaries between them. You can specify a minimum and maximum for each slice of the pie, which can be the same if a slice can't vary in size. As for all input devices, there are no restrictions on what variables are used for the allocation input, though different elements of an array would be a common usage.
Allocation inputs can be used with any model variable, though constants would be most commonly used. You don't need to specify an override; if you adjust the input, the variables (all of them) will be controlled at the values you set.
For more information about placing and editing allocation inputs, see Working with Objects.
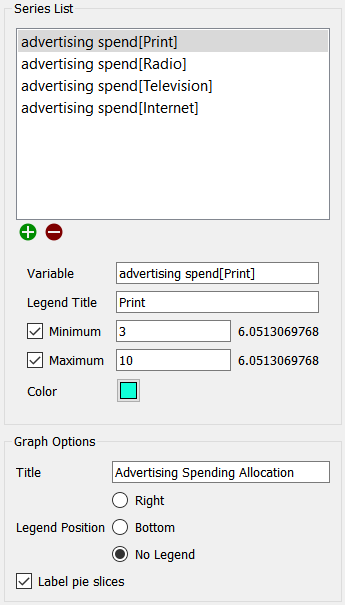
This list lets you select the variables controlled by the allocation input, and the way in which they're displayed. For consistency with the graph, a variable, along with the associated information for displaying it, is called a series. Use the ![]() button to add a new series or the
button to add a new series or the ![]() button to remove the selected series from the object (this doesn't change the model itself, only the input object).
button to remove the selected series from the object (this doesn't change the model itself, only the input object).
Variable is the model variable to plot. You can type in a value (you'll be prompted for a name), drag a value from the Find window, or Ctrl-drag (⌘-drag on Mac) a variable from the model diagram.
Legend Title is the title that will be displayed for the series, either on the right or at the bottom, and optionally directly on the input, depending on your choice under Legend Position below.
Minimum, if checked, is the minimum value to use for the variable. If this is left empty, the minimum will be 0.
Maximum, if checked, is the maximum value to use for the variable. If left blank, there will be no maximum value, though other variables with a minimum value may prevent the variable from taking up all of the allocation.
Color is the color that will be used when displaying the variable. Click on the square to change the color.
Title is the title that will be displayed at the top of the allocation input.
X Axis Title is the title that will be displayed at the bottom of the graph.
Legend Position determines where the legend for the series identifiers will appear. Select Right, Bottom, or No Legend (to hide the legend).
Label pie slices, if selected, will put labels directly onto the pie slices in the allocation input. This can make it easier to read the input when there are a relatively small number of things being shown.