Use a graphical input to add a graph to your model.
You can use the graph to display whatever variables you want, in a way that may be more explanatory than a list of numbers.
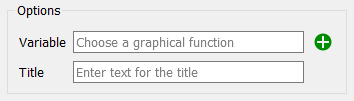
Variable specifies the variable(s) that will be displayed on the graph.
Title specifies what title will be displayed under the graph.
Though it has a somewhat different appearance, the graphical input functions the same way that it does for model construction, as described in Graphical Function Tab discussion.
The graphical input will appear as:
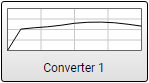
Click on it to open the graphical input editor:
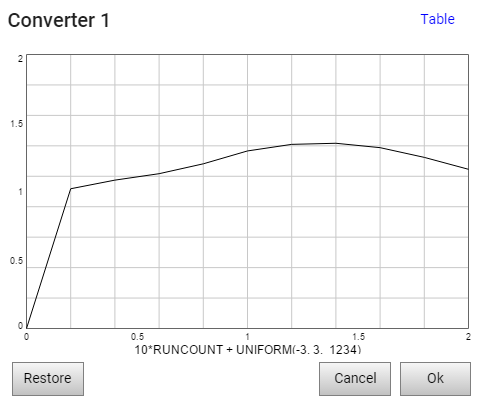
You can drag individual points or trace along a line to change the shape of the curve. By clicking on the Table link in the upper right hand corner, you can enter values as x,y pairs:
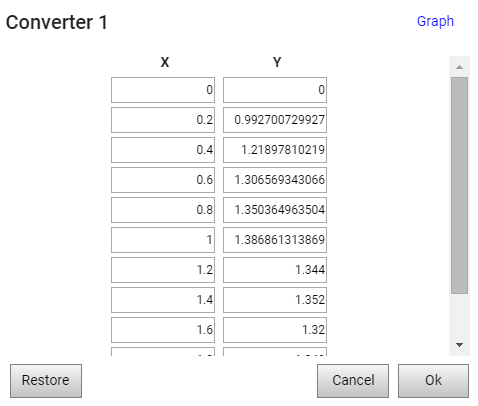
The Restore button will restore the graphical to its original value (either model defined or imported). Okay will accept your changes, and Cancel will throw them away.