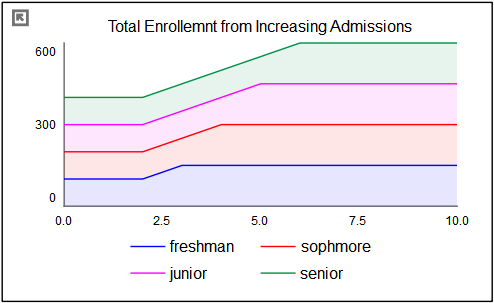
The area graph is a variation of the line graph, in which the location of each line is determined relative to the line below it, rather than the bottom of the axis. This is a very good way of showing the composition of a number of like things, such as population in different regions, sales at different stores, production of different crops, or students at a college.
Area graphs draw as a simulation progresses (or when scrubbing from the bottom toolbar).
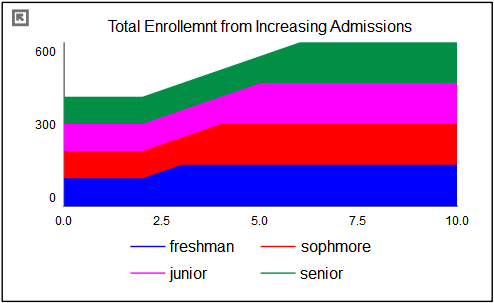
Select the graph ![]() from the Interface Build toolbar, and click on the page at the location you want it to appear (you can also add a page to an existing graph you've already put down). On the graph panel, select type Area at the top.
from the Interface Build toolbar, and click on the page at the location you want it to appear (you can also add a page to an existing graph you've already put down). On the graph panel, select type Area at the top.
The options and styles for the area graph are the same as those for other graphs (see Styles Tab for more discussion).
The colors for the area graph will follow the color sequence set for the model (see Graph Styles Properties Panel), but you can specify the color used for each variable directly.
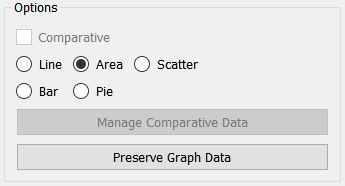
The area graph allows you to set the fill intensity between the different lines. The default, shown above, is 0.1 (10%), but you can select 0:
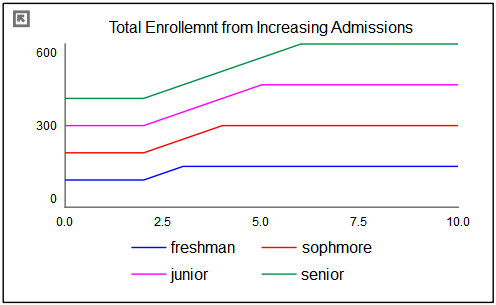
Or you can set it to 1.0:
to achieve different effects.