Use the Styles tab ![]() on Graphs to set colors, fonts and location as you would with any object (see the general Styles Tab information). In addition, graphs have the following options on the Styles tab.
on Graphs to set colors, fonts and location as you would with any object (see the general Styles Tab information). In addition, graphs have the following options on the Styles tab.
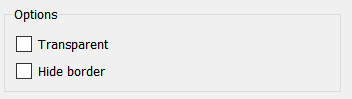
Transparent, if checked, will allow everything underneath the graph to show. This can allow for interesting special effects, even allowing multiple graphs to draw on top of one another, but can also be confusing. Use with caution.
Hide border, if checked, will hide the rectangular border drawn around the outside of the graph. This can make for cleaner presentation and is especially useful when pasting graphs into other applications.
Graphs have a number of different colors (in addition to the colors for the plot lines). To change these click on the button at the left displaying the color.
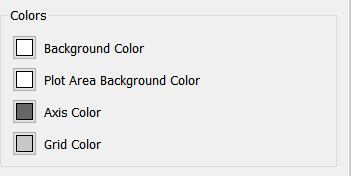
Background Color is the color drawn outside the plot area.
Plot Area Background Color is the color drawn inside of the plot area.
Axis Color is the color used to draw and x and y axes.
Grid Color is the color used to draw the grid (if it is shown) over the graph.
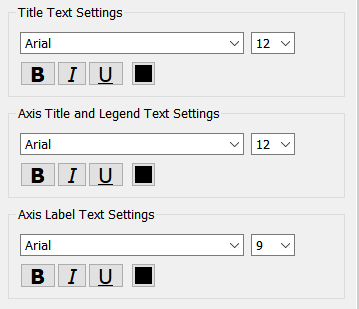
This is for the title that appears at the top of the graph.
This is for the legends as well as the x and y axis descriptions. The numbers displayed along the x and y axis are set with the Axis Label Text Settings.
This is for the numbers that appear along the x and y axes in the graph.
This is the title and header text used in the table (both row and column labels).