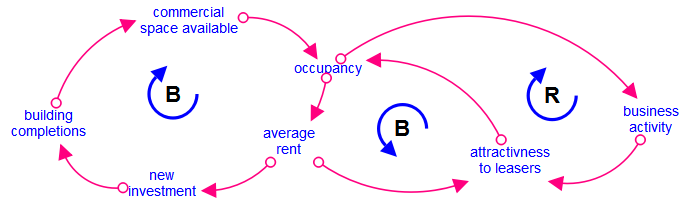
Here we use B to denote a balancing loop and R to denote a reinforcing loop. To learn how to build conceptual CLDs, see Creating CLDs.
A useful way to explain or communicate your model is to present it, or a simplification of it, as a causal loop diagram (CLD). A CLD lets you show only the dominant feedback loops or selected causal connections between variables in your model.
By using a CLD, other people can quickly see the overall causal relationships in the model without being distracted by the other details that are necessary to simulate the model. There are two approaches to creating causal loop diagrams.
Here we use B to denote a balancing loop and R to denote a reinforcing loop. To learn how to build conceptual CLDs, see Creating CLDs.
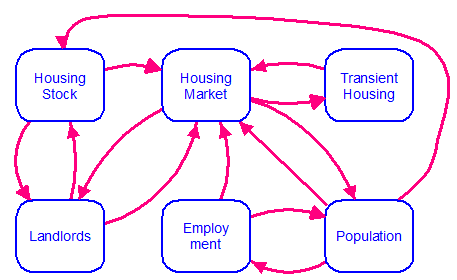
For more information on building module maps, which are a natural result of organizing your model into modules, see Working with Modules.