Use spatial map to display information about values in an array across one, or more commonly, two dimensions. This can be used to highlight different attributes across the array elements, or to present a heat map when the array dimensions have a spatial interpretation.
A spatial map will animate during a simulation (or when scrubbing from the bottom toolbar) and retain the final value at the end of a simulation.
Note Spatial map is only available on the interface, and the button to add it is hidden for models that do not have any arrays defined.
Select spatial map ![]() from the Interface Build toolbar, and click on the page at the location you want it to appear. After placing it, you can size it by dragging its sizing handles or using the Properties panel.
from the Interface Build toolbar, and click on the page at the location you want it to appear. After placing it, you can size it by dragging its sizing handles or using the Properties panel.
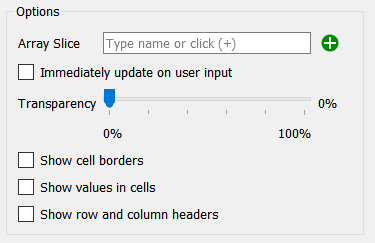
Array Slice names the array, and which elements, to be displayed. Click on the ![]() button to select from the Find window, or type in a name and it will autocomplete. After you select a variable to use the Choose Subscript dialog box will open so you can select which slice to use. Select * for the 1 or 2 dimensions you want the spatial map to display.
button to select from the Find window, or type in a name and it will autocomplete. After you select a variable to use the Choose Subscript dialog box will open so you can select which slice to use. Select * for the 1 or 2 dimensions you want the spatial map to display.
Immediately update on user input, if checked, will display the values that will be computed when the model is paused. If it is not checked, the values for converters and flows computed during the previous DT (Save Interval) will be displayed.
Transparency allows you to change the appearance of the spatial map relative to other elements on the page. Use 0 to display the spatial map with nothing underneath showing through. Move toward 100% transparency to allow more and more of any objects under the spatial map to show. Transparency allows you to achieve special effects on the interface and color in a picture underneath the spatial map.
Show cell borders, if checked, will place white dividers between the cells giving it more of the appearance of a grid.
Show values in cells, if checked, will display the values of the different elements using the formatting in the scales and ranges tab of the variable's definition. The text will be centered bother vertically and horizontally.
Show row and column headers, if checked, will put row and column headers using the name, or number, of the array elements being displayed in the two directions. Labels will be created inside the bounds for the spatial map and thus will decrease the size of the displayed map elements.
Set up ranges to determine how different values that array elements take on will be displayed.
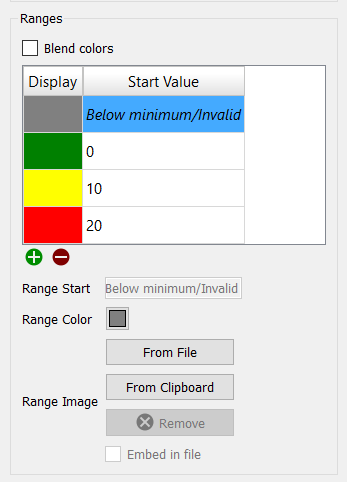
Blend colors, if checked, will cause values between the displayed start values to blend the color selections so that the transition from one color to another will be continuous. Values below the first will always be displayed with the Below minimum/Invalid color. Values above the last will always be displayed with the highest value color.
The remaining options are operated on by fist selecting a row in the list of colors and start values. Use ![]() to add items to the list and the
to add items to the list and the ![]() button to remove items from the list. The items in the list are always sorted by the Start Value column which means if you change a value it may reposition the entry in the list.
button to remove items from the list. The items in the list are always sorted by the Start Value column which means if you change a value it may reposition the entry in the list.
Note To add something to a specific position in the list first click the ![]() button then edit the Range Start value to correspond to the position in the list you want it to appear. Press the enter key to make it change its position in the list.
button then edit the Range Start value to correspond to the position in the list you want it to appear. Press the enter key to make it change its position in the list.
Range Start specifies the beginning of the range. The end of the range is specified by the next entry in the list. The first entry in the list is always Below minimum/Invalid and this value cannot be edited for that entry.
Range Color specifies the color for the value specified. The color will be used until the next value is reached, or it will be blended with the next value.
Range Image controls the appearances of images that are displayed when array element values are greater than or equal to range start and not yet equal to range end. By default, no images are displayed.
From File lets you choose a file containing a picture (a bmp, png, gif, jpg, or jpeg file). The picture will be displayed when the value is reached.
From Clipboard copies the content of the clipboard for display when values are in range. The clipboard must contain content that can be rendered as a bitmap or this button will be disabled.
Remove takes away the current picture, regardless of its source.
Embed in file causes the picture to be embedded directly in the model file so there is no reason to reference an external file. This option is only available when the picture was added using the From File button (images from the clipboard will always be embedded).
In addition to size and position you can specify the fonts to be used for headers (if Show row and column headers is checked) and values (if Show values in cells is checked).