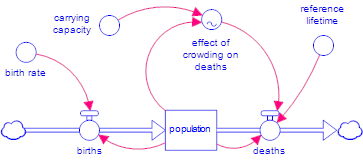
We'll start with a simple population model, with growth limited by carrying capacity. This model will let us demonstrate some of the basic principles of stocks and flows, and the importance of feedback in determining behavior.
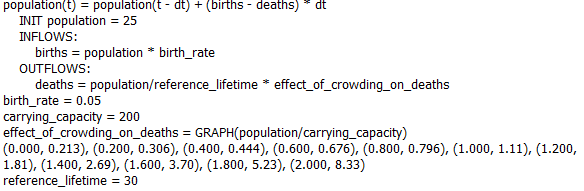
You can get this model from the isee Exchange, or build it yourself using the values above, or work through the Model Building Tutorial.
Open Designer
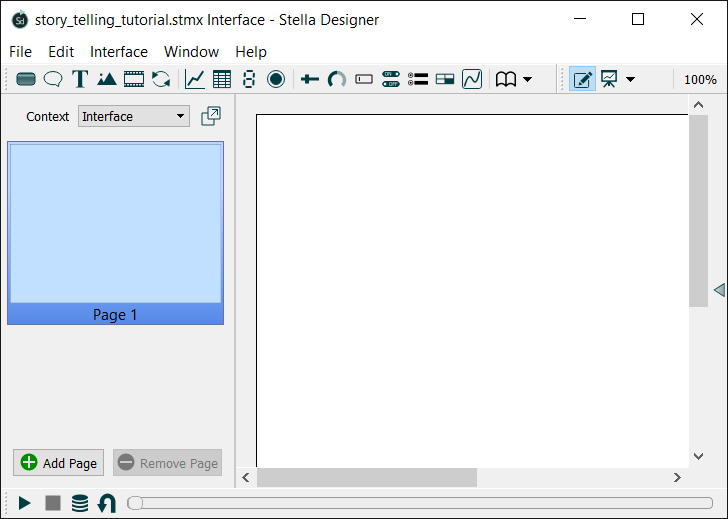
If you have Stella Designer start it, then download and open the model to view it (you won't be able to build the model using Stella Designer). If you have Stella Architect, and are in the model window, go to the interface window (select Open Designer from the Window menu, or click on ![]() in the Mode toolbar).
in the Mode toolbar).
You should see an empty page, with an empty thumbnail to the left:
Plan out the Flow
For our simple example, we'll open with a welcome page, then move to a single page where the user can experiment with changing the birth rate, normal lifetime, and carrying capacity, to see the effect they have on population dynamics. From there, we'll offer them the opportunity to explore a story showing how the different elements of model structure cause the observed behavior. At the end of the story, we'll return them to the second page to continue experimenting. In total, we'll end up with two pages plus a story.
Build out the Basic Flow
Click on the Text Box tool ![]() on the Interface Build toolbar, then click in the upper middle part of the page and type in "Population with Limits to Growth". You can type directly into the text box you created, or in the "Text" area in the panel to the right, where you can see what you've typed in. You can change the font by using the styles tab
on the Interface Build toolbar, then click in the upper middle part of the page and type in "Population with Limits to Growth". You can type directly into the text box you created, or in the "Text" area in the panel to the right, where you can see what you've typed in. You can change the font by using the styles tab ![]() , at the bottom of the same panel on the right.
, at the bottom of the same panel on the right.
Click on the Button tool ![]() on the Interface Build toolbar, then click in the lower middle part of the page. An empty button will be added, and the panel will update to let you configure the button. The top will give you options for adding a picture to your button and let you give it a name ("Start Exploring"), and the bottom half will look like this:
on the Interface Build toolbar, then click in the lower middle part of the page. An empty button will be added, and the panel will update to let you configure the button. The top will give you options for adding a picture to your button and let you give it a name ("Start Exploring"), and the bottom half will look like this:
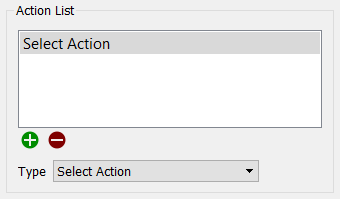
Click on the Select Action dropdown, scroll down, and select Navigate to Page. When you do this, a second dropdown will appear below it. Use this second dropdown to select Next Page.
Now click on the  button, at the bottom of the left-hand panel (or select Add Page from the Interface menu). You'll have a new blank page called, to begin with, Page 2. For large interfaces, it's very helpful to name the pages, so we'll try this here. You can name the page from the properties panel. The properties panel will probably be open when you create the new page, but if it's not, double click on any blank part of the page to open it (since the current page is blank, anywhere will do). Near the bottom of the panel, you'll find a space for the page name:
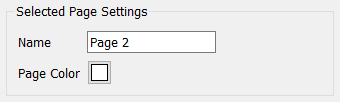
In the name box, change "Page 2" to "Experimentation". Then, go back to Page 1 and rename it "Landing Page".
Now, we want to be able to navigate from the Experimentation page to the story, but to lay that out, first we need to create a story. Click on the story button ![]() in the Interface Build toolbar (or select Add Story from the Interface menu). The Create Story dialog will open:
in the Interface Build toolbar (or select Add Story from the Interface menu). The Create Story dialog will open:
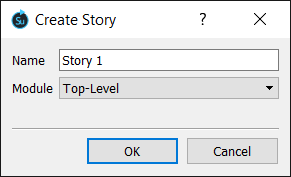
Stories, like pages, can be named, so type in "Exploration" as the name of our story. Our model only has a single module, so only Top-Level is available from the dropdown for this story. When you click OK, the Setup visibility dialog will open:
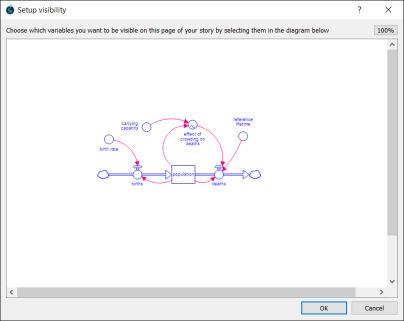
Stories are built around model structure, and part of that structure is displayed, effectively as the background, on each page of a story. For the first page of the story, we want only the "Population" stock, so click on that, then click OK. You'll get a story page with only Population visible. We'll come back to finish the story in the next step, but first, let's make our link from the interface to the story.
Click on the Go to Interface ![]() button in the tool bar (or select Go to Interface from the Interface menu). Then, click on the Experimentation page from the list of pages on the right.
button in the tool bar (or select Go to Interface from the Interface menu). Then, click on the Experimentation page from the list of pages on the right.
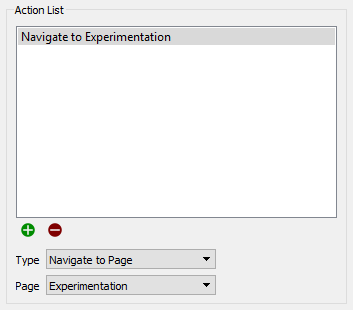
Click on the Button tool ![]() , then click in the lower middle part of the page. This time, label the button "Explore Structure", and select the action Navigate to Story - the first page of the first story will be selected by default, and, since there's only one story, with only one page so far, we have our button all set up.
, then click in the lower middle part of the page. This time, label the button "Explore Structure", and select the action Navigate to Story - the first page of the first story will be selected by default, and, since there's only one story, with only one page so far, we have our button all set up.
Now our navigation structure is all laid out, except for the return from the end of the story back to the Experimentation page. To do that, we need to fill in the pages for the story.
Finish the story pages
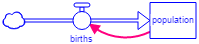
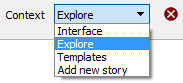
Return to the story you started creating by selecting it from the Context dropdown  at the top of the list of pages. As we add pages to the story, we'll reveal more of the model structure. On page 1, you should see in the middle of your page:

Now, add a new page to the story using the Add Page button at the bottom of the left-hand panel, or by using the Interface menu. The setup visibility dialog will open. Click on "births", and click OK. Add a third page, adding in the connector from Population to births. Your latest page should look like:
Add another page, and this time add in "deaths" and the connector from Population to deaths. This page should look like:

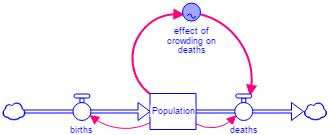
Add another page, and add "effect of crowding on deaths", as well as the link from Population to it, and the link from it to death. This page should look like:
Finally, we'll add everything left on the diagram. Add a new page, then click and drag your mouse across the model. This will select (and highlight) the whole structure. Click OK. Without adding a new page, go to the panel on the right and click the button marked "Highlight variables". Drag your selection over the entire structure, removing the highlight from everything. (Drag selecting like this toggles highlights if everything is already highlighted, but otherwise it will highlight everything selected.)
On this final page of the story, let's add a button to return us to the experimentation page. Click on the Button tool ![]() , then click in the lower middle part of the page. Label the button "Continue Experimenting", and then set it to navigate to our Experimentation page.
, then click in the lower middle part of the page. Label the button "Continue Experimenting", and then set it to navigate to our Experimentation page.
Build the Experimentation page
We want to let our users set the assumptions in the model and see the resulting behavior. There are four basic assumptions in this model: birth rate, average lifetime, carrying capacity, and the relationship between crowding and deaths (effect of crowding on deaths). The key result is Population, and we'll use a graph to show that.
Return to the Experimentation page by selecting Interface from the context dropdown above the pages of the story, then clicking on the second page.
Run the model by clicking on the play ![]() button on the Run toolbar (at the bottom), or by selecting Run from the Interface menu. Then save the run by clicking on the
button on the Run toolbar (at the bottom), or by selecting Run from the Interface menu. Then save the run by clicking on the ![]() button on the Run toolbar. A dialog will open, prompting you for a name. Enter "Baseline". Then click on the
button on the Run toolbar. A dialog will open, prompting you for a name. Enter "Baseline". Then click on the ![]() button on the Run toolbar. This will keep the Baseline run, but it won't be considered the current run anymore.
button on the Run toolbar. This will keep the Baseline run, but it won't be considered the current run anymore.
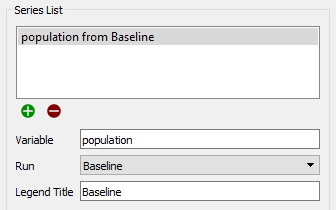
Add a graph to the upper right area of the experimentation page by selecting Graph ![]() from the Interface Build toolbar, and clicking where you want to put it. The properties panel for the graph will open on the right. Use the
from the Interface Build toolbar, and clicking where you want to put it. The properties panel for the graph will open on the right. Use the ![]() button in the Series List section, and select Population in the dialog that appears. In the dropdown for Run, just below this, select Baseline (it will say Current Run by default). Below that, for the Legend Title, enter "Baseline". You should see something like this:
button in the Series List section, and select Population in the dialog that appears. In the dropdown for Run, just below this, select Baseline (it will say Current Run by default). Below that, for the Legend Title, enter "Baseline". You should see something like this:
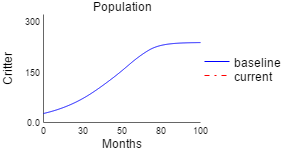
Use the ![]() button and choose Population again, but this time leave the Run alone, and for the Legend Title type in "Current".
button and choose Population again, but this time leave the Run alone, and for the Legend Title type in "Current".
If you scroll down, lower in the panel there's a place to enter the Title of your graph. Just type in "Population". Your graph should look like this:
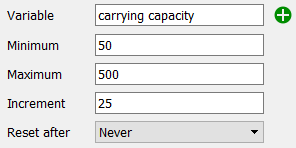
Put down a slider for carrying capacity by clicking on the Slider tool ![]() in the Interface Build toolbar and dropping it on the page to the left of the graph. The panel for the slider will open. Click on the
in the Interface Build toolbar and dropping it on the page to the left of the graph. The panel for the slider will open. Click on the ![]() icon at the right of Variable, and select carrying capacity. Give it a minimum of 50, a maximum of 500, and an increment of 25. The top of the panel should look like this:
icon at the right of Variable, and select carrying capacity. Give it a minimum of 50, a maximum of 500, and an increment of 25. The top of the panel should look like this:
Repeat that to add another slider for birth rate (minimum: 0; maximum: 0.1; increment: 0.01) and reference lifetime (minimum: 10; maximum: 100; increment: 5).
Click on the Graphical Input tool ![]() on the Interface Build toolbar, and put one below the sliders. In the panel, click on the
on the Interface Build toolbar, and put one below the sliders. In the panel, click on the ![]() icon and select "effect of crowding on deaths" from the find dialog (in this case, it'll be your only option available).
icon and select "effect of crowding on deaths" from the find dialog (in this case, it'll be your only option available).
Select Button ![]() on the Interface Build toolbar and place it below the other controls, then select Run from the dropdown (the button will automatically be labeled "Run"). Place another button and select Restore All Devices from the dropdown (the button will automatically be labeled "Restore").
on the Interface Build toolbar and place it below the other controls, then select Run from the dropdown (the button will automatically be labeled "Run"). Place another button and select Restore All Devices from the dropdown (the button will automatically be labeled "Restore").
Your page should look like this:
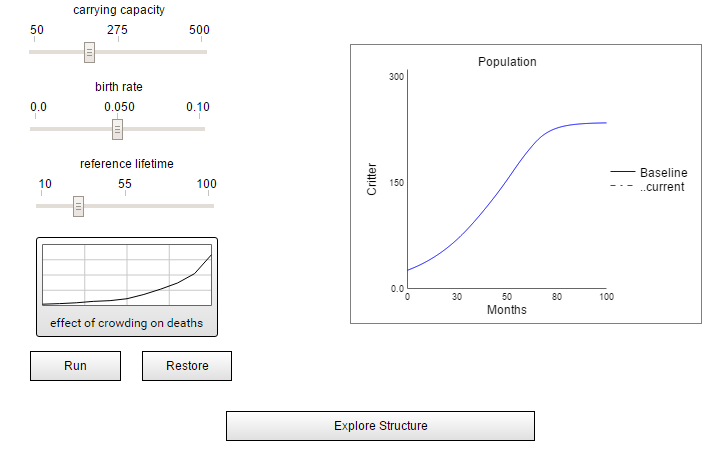
Click on Presentation Mode ![]() to see how this page behaves. Drag a slider (or click on the graphical input and change things from there), then click on Run to see the results. Use the Escape (Esc) key to get out of presentation mode.
to see how this page behaves. Drag a slider (or click on the graphical input and change things from there), then click on Run to see the results. Use the Escape (Esc) key to get out of presentation mode.
Add Control and Annotation to the Story
While we laid out a complete story, the content so far consists only of the model structure in various stages of unfolding. We want to add a control to simulate, an annotation to each step, and a graph to show our results. We'll edit the story backwards, in order to lay out the page so that everything fits when the whole structure has been revealed.
Before leaving the Experimentation page, copy the graph and run button into the clipboard. To do this, click on the graph, then hold down the shift key and click on the button. Now select Copy from the Edit menu (or use the keyboard shortcut of Ctrl+C [Windows] or ⌘+C [Mac]).
Above the list of pages, select Exploration from the dropdown list and click on Page 6 (the last page). Paste the material you copied using Paste from the Edit menu (or use the keyboard shortcut of Ctrl+V [Windows] or ⌘+V [Mac]).
Adjust the position, and possibly size, of the graph and run button, so that they don't interfere with the model diagram.
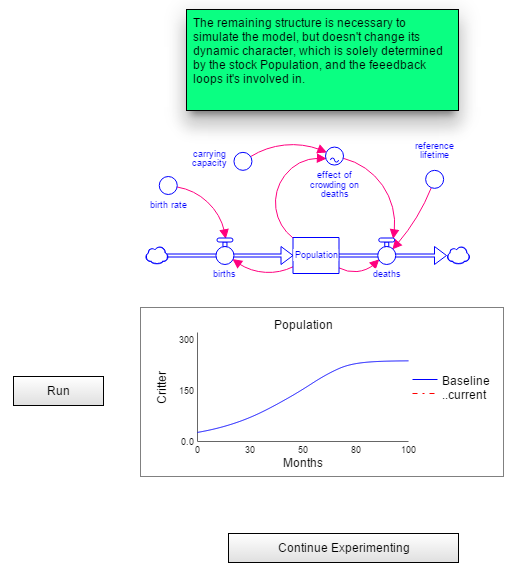
Click on the Annotation Button ![]() in the Interface Build toolbar, then click above the stock and flow diagram (or in another place, if you put the graph there). Double-click on the annotation and type in whatever text you want. Right now, we'll put in some text explaining the final step (see below). Then, click on the Style tab
in the Interface Build toolbar, then click above the stock and flow diagram (or in another place, if you put the graph there). Double-click on the annotation and type in whatever text you want. Right now, we'll put in some text explaining the final step (see below). Then, click on the Style tab ![]() of the panel, and select a color you like for the annotation's background. Your page should look something like this:
of the panel, and select a color you like for the annotation's background. Your page should look something like this:
Create a template for the story pages
As the user goes through the story, it's helpful if some things remain in the same position on each page. You can accomplish this by copying and pasting the objects you want to reuse, but using templates provides a more flexible solution.
Select the Run button and the graph, and then select Cut from the Edit menu (or use the keyboard shortcut of Ctrl+X [Windows] or ⌘+X [Mac]).
In the dropdown at the top of the Pages Panel(Interface), select Templates.
You'll see an empty template called, as you might expect, Template 1.
Select Paste from the Edit menu (or use the keyboard shortcut of Ctrl+V [Windows] or ⌘+V [Mac]). The button and graph should show up in the same position they were in on the story page.
Return to your story using the dropdown at the top of the Pages panel.
Click on the first page of your story, and then open the panel if it isn't open, by clicking on the ![]() at the right of the window.
at the right of the window.
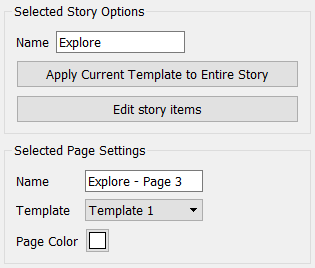
Toward the bottom of the panel, select Template 1 as the template, then click on the Apply Current Template to Entire Story button.
The last page of your story will look the same as it did before you cut the button and graph from it. The button and graph now appear on every page of the story. If you change the template, the appearance of every page will change (but you won't be able to change the template contents from the story pages; you have to go to the template page to do that.
Add annotations to all the pages
For each of the other pages, add an annotation and move it closer to the structure being revealed. The suggested annotations, in sequence, are:
Force Restore before starting the story
A small thing, but after experimentation, the settings might cause very different behavior relative to the base run. For the story to work best, we should reset the inputs and clear the current run before entering the story.
Click on the Explore Structure button. In the panel to the right, click on ![]() to add an action and select Restore All Devices from the dropdown. Then drag Restore All Devices above Navigate, so it's first in the list.
to add an action and select Restore All Devices from the dropdown. Then drag Restore All Devices above Navigate, so it's first in the list.
Publish your interface
The interface you developed is now web ready. To publish it, select Publish from the File menu. A new window, which is actually a simple web browser, will open and ask you to sign in:
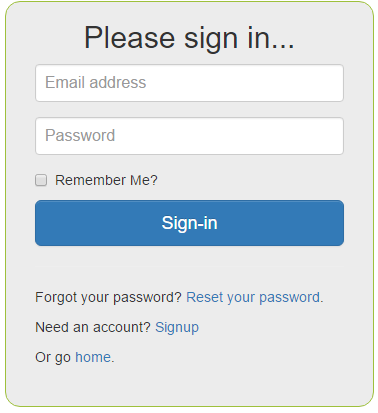
If you haven't created an account on isee's exchange yet, do that now - it's free and easy. Then once you're logged in, you can create a new Simulation (what we call the model and interface working together), and click on upload to put everything online. Anyone with a (modern) web browser can then work with the simulation you've published.
Refining the interface
The Experiment page you've built allows the user to make changes and then click on Run. But why make them wait? We can, instead, start Stella live when we enter the page.
On the first page of the interface, click on the button Start Exploring to open its panel, and in the panel click on ![]() to add an action. Add Start Stella Live as the action. On the experimentation page, change the Restore button to Restore Inputs and delete the Run button (it's no longer needed). Add Stop Stella Live as an action for the Explore Structure button.
to add an action. Add Start Stella Live as the action. On the experimentation page, change the Restore button to Restore Inputs and delete the Run button (it's no longer needed). Add Stop Stella Live as an action for the Explore Structure button.
On that last page of the story, add Start Stella Live as an action for the Continue Experimenting button.
Finally, on the Interface Setting Panel (double-click on an empty part of the Landing Page), check the box for "Stella Live updates on drag".
Now, the user doesn't need to click the run button on the Experimentation page. Note, however, that starting the interface on the experimentation page will no longer work properly; instead, the interface has to be started from the Landing page.