In the Model window, use the Graphical Function tab to define a converter or flow as a graphical function.
To view the Graphical Function tab, click the ![]() at the bottom of the Properties panel. For more information about using panels, see Using the Properties Panel.
at the bottom of the Properties panel. For more information about using panels, see Using the Properties Panel.
Note: To view the Graphical Function tab, you have to select a converter or flow.
Select the graphical check box to transform the selected converter or flow into a graphical function.
To delete the graphical function relationship from the variable, clear the Graphical check box.
Select the apply to all checkbox to have the same graphical used for all elements of an arrayed variable. This option is only available for a variable that has been defined as an arrayed variable.
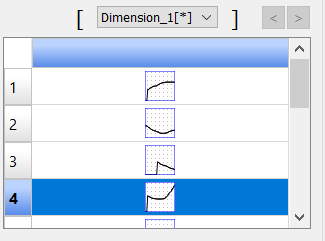
If checked, there is only one graphical to edit for all array elements. If unchecked, there will be a dropdown box to select which element of the array to edit the curve for:
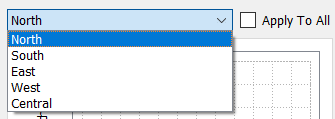
The element to edit can also be selected at the bottom of the panel as noted below.
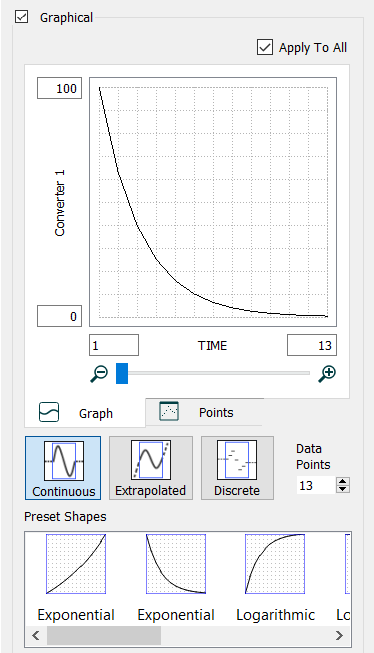
Use the options on the Graph tab to define the graphical function, by drawing a graph of the function.
Grid
This displays the curve for the graphical function.
- To draw the curve manually, click and drag in the grid to sketch the curve. A circle indicates your current location on the curve. As you draw, the associated Y-axis coordinates of the curve will appear in the output of the table on the Points tab.
- To edit the curve, click and drag the section of the curve that you want to move.
Tip: You can also edit the input and output values, and so change the curve, by typing new values in the table on the Points tab.
Y-axis minimum and maximum
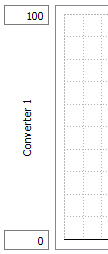
Specify the Y-axis minimum and maximum values in the two boxes to the left of the graphical function grid. The number in the bottom box (the minimum value) has to be less than the number in the top box (the maximum value).
The values in these boxes set the output range for the graphical function.
Variable name
The name of the variable you're defining the graphical function for appears to the left of the graphical function grid. Here it says "Converter 1", but it will take on the same name as the converter or flow it's defining, which you can type right on the converter or flow.
X-axis minimum and maximum
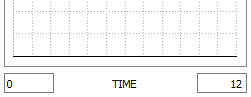
Specify the X-axis minimum and maximum values in the two boxes beneath the graphical function grid. The number in the box to the left (the minimum value) must be less than the number in the box to the right (the maximum value).
The values in these boxes set the input range for the graphical function.
The minimum value you enter here becomes the first entry in the left column of the table on the Points tab.
The maximum value you enter here becomes the last entry in the left column of the table on the Points tab.
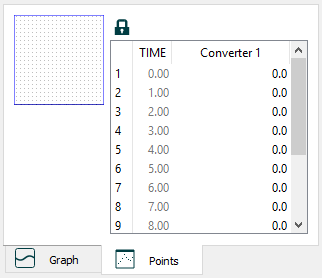
Use the table on the Points tab to define the graphical function, by specifying point values for the function.
Tip: You can also edit the output values by dragging the curve in the grid on the Graph tab.
<expression> Input (independent) values column – This column displays and allows you to edit the input (X-axis) values for the graphical function. The default input variable is TIME, but you can specify any expression in the equation for the graphical function variable (on the variable's Equation panel). The initial values displayed in this column are determined by the values entered in the X-axis minimum and maximum boxes on the Graph tab.
To edit the values in this column, first unlock the column, by clicking ![]() (above the column), then type new values into the column. When you edit input values, the curves displayed on the Points tab and the Graph tab will change to reflect these new values.
(above the column), then type new values into the column. When you edit input values, the curves displayed on the Points tab and the Graph tab will change to reflect these new values.
Note: X-axis values must be in order of value, from low to high. If you try to enter a value that is not between those before and after it you will receive an error message.
<varname> output (dependent) values column – This column displays and allows you to edit the output (Y-axis) values for the graphical function. The output values are generated automatically when you sketch a curve in the grid on the Graph tab.
To edit the values in this column, click the value you want to edit and then type a new value (or paste the new value). When you edit output values, the curves displayed on the Points tab and the Graph tab will change to reflect these new values.
Tip: You can import or export graphical function output values by creating data links to your model from an Excel or .CSV file; these links allow you to import data from a spreadsheet and to export data to the same or a different spreadsheet. For more information, see Importing and Exporting Data.

Type the number of data points that the graphical function will contain (you have to specify at least two data points). The number you enter here determines the number of points on the graph displayed in the grid on the Graph tab, and the number of rows in the table on the Points tab.
If the graphical function contains more data points than you can easily view on the Graph tab, drag the zoom slider beneath the grid to zoom in and out on the curve. Drag the slider toward the "-" sign to zoom out. Drag the slider toward the "+" sign to zoom in.

If a graphical function contains more data points than you can see at once in the table on the Points tab, scroll bars will appear so you can scroll up and down the table list.
Click the appropriate button to select the type of graph you want to use for the graphical function. The type you select affects the appearance of the graph on the Graphical Function tab. It also tells the software how to calculate values in the function that aren't specified by the data points (that is, how to calculate values that are off the graph):
 – Click this button to use a continuous graph. With a continuous graph, the curve is a continuous line. Values between given data points are interpolated, resulting in as smooth a curve as possible. Values that are off the graph (either at the start of the curve or the end of the curve) are held horizontally at the last value, to infinity. For example, if the last value on the graph is 25.0, all values further to the right, off the graph, are assumed to be 25.0. Continuous is the default graph type.
  – Click this button to use a continuous extrapolation graph. With a continuous extrapolation graph, the curve is a continuous line. Values between given data points are extrapolated, resulting in as smooth a curve as possible. Values that are off the graph (either at the start of the curve or the end of the curve) are extrapolated so that they extend the curve linearly based on the last two graphed data points. For example, if the last two values on the graph are 90 when x is 9, and 100 when x is 10, then when x is 11 the value will be 110, when it's 12 the value will be 120, and so on.
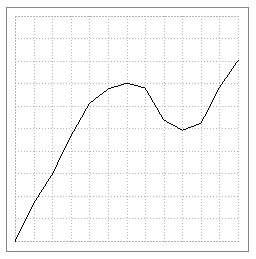
 – Click this button to use a step graph. With a step graph, the curve is a series of flat, unconnected line segments. Like the continuous graph, values that are off the graph (either at the start of the curve or the end of the curve) are held horizontally at the last value, to infinity. For example, if the last value on the graph is 25.0, all values further to the right, off the graph, are assumed to be 25.0.
The following picture shows the difference between the same curve graphed as a continuous and as a step graph.
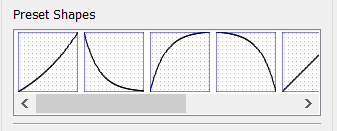
There are a number of preset shapes available to simplify the process of creating a smooth graphical relationship. Rather than typing in points or drawing the initial shape, you can start from one of the different presets.
Select one of the line shapes by clicking on the shape in the panel. The graph points will be replaced with those of the shape. After clicking (except for the linear shapes) a slider will become visible allowing you to set curvature:
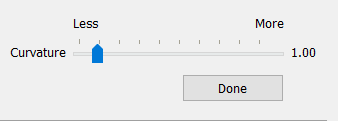
Drag the slider to increase or decrease the curvature which varies from 0.1 to 10. As you move the slider the points or graph will change. When you are satisfied with the shape click on Done.
After you finish adjusting curvature you can edit the graph or points as described above.

To define a separate graphical function for each element in the array, clear this check box as noted above. If you clear this check box, in addition to the dropdown, a table will appear in the Equation box where you can define graphical functions for each element/dimension combination.
For more information about defining graphical functions for arrayed variables, see Creating a Graphical Function.