Table Properties
Use the Table Settings tab of the Properties panel to view and edit the properties of the selected table. Use the Table Styles Tab to specify colors and fonts. (See Getting Started Online for differences in online editing).
Table Settings tab
- Add/delete page - click
 or
or  to add or delete a page. You can add a graph by clicking on the
  in the dropdown and selecting Add a New Graph (this will open the Graph Series Property Panel).
- Previous/next page - click
 or
or  to move to the previous or next page.
You can reorder pages by clicking on  and rearranging the sequence in the Reorder Pages
Once you add more than one page you will also see an icon  to edit multiple pages in the collection (collections mixing graphs and tables do not have common elements to edit). See Pages Styles (Interface)for more discussion of the pages.
Table Options
- Title - use this option to enter a title for the table.
- Selection Label specified the label that will be used if the table pages are selectable using tabs or a dropdown list. This is only visible when working on the interface and when there are multiple tables included.
- Mark for Export - check this to have the table available for export in the Export Data dialog box
- When checked, fill in the name you'd like to refer to the table by for selection during export setup.
- Data Orientation lets you specify which way time runs.
- Vertical Time, if checked, will make time run down, so that each column is a variable.
- Horizontal Time, if checked, will make time run across, so each row is a variable.
- Comparative - select this check box to create a comparative table, which shows successive runs.
- Stash Data - checking this option adds the
 icon to the table that, when clicked, is used to keep the values in the table for the current run when a new run is made. See Stash Data for more discussion.
Series List
Percentiles (model only)
The option to show percentiles is only available if comparative has been selected and you are working in the model window. Percentiles are displayed for all times.
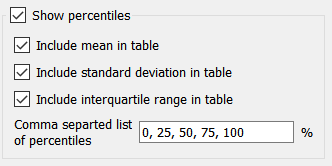
Show percentiles, if selected, will display percentile values across all runs rather than values from individual runs. This option is only available for comparative tables.
Include mean in table, if checked, will display the arithmetic average across runs in the table. The minimum, maximum, and median can be included by specifying the percentiles 0, 50, and 100 respectively, and the labeling with reflect this.
Include standard deviation in table, if checked, will display the standard deviation across runs.
Include interquartile range in table, if checked, will include the difference between the 25th and 75th percentile values.
Comma separated list of percentiles is the list of what will be displayed. Use 0 for the minimum, 50 for the median and 100 for the maximum. You can include as few or many as you want. Values less than 0 will be treated as 0 and greater than 100 as 100.
Reporting Options
- Show values at start/end of interval - choose whether values should be shown at the start or the end of the interval.
- Show instantaneous flow values/flows accumulated over interval - choose whether to show an accumulated value or to show the current value.
- Interval - choose a time interval for which you want to display values. Click Every DT to display values at the model's time interval setting.
- Time - if you set the model's Time Unit to months, select the Use Month Names check box to use month names in the time rows or columns.