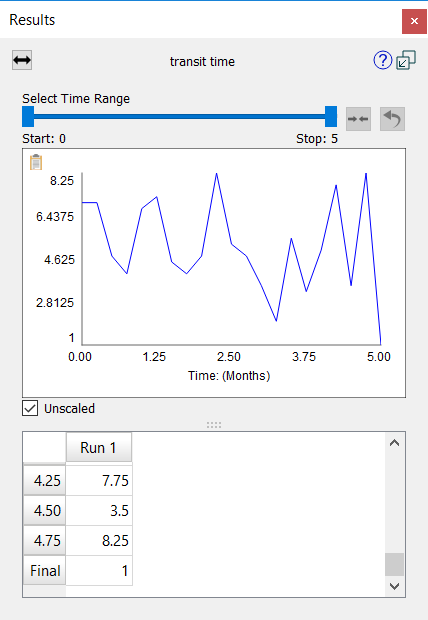
The results panel lets you see graphs of results from the model simulations you've made.
Use the Causes Uses button (![]() ) to navigate to causes and uses of the current variable. See Causes Uses.
) to navigate to causes and uses of the current variable. See Causes Uses.
Drag the handles of the slider (![]() ) to change the time range over which values will be displayed. You can Narrow this range are much as you like by dragging these handles toward one another. After doing this click on
) to change the time range over which values will be displayed. You can Narrow this range are much as you like by dragging these handles toward one another. After doing this click on ![]() to refine the granularity of the handle movement. Repeating this will allow you to view values at specific DTs. Click on
to refine the granularity of the handle movement. Repeating this will allow you to view values at specific DTs. Click on ![]() to view values for the entire run.
to view values for the entire run.
Note If the Causal Lens™ is open when you first open the Results Panel the time range will be set as it is in the Causal Lens.
For more information on working with the Results panel, see Results Panel