Click the diagram to place the financial table.
The financial table will appear, and the table properties will appear in the Properties panel.
Use the properties panel to define one or more pages in the table.
The financial table is a variation of the standard table (see Tables) that makes it easier to customize format and display income and balance sheet items in a coherent fashion. Financial tables can be collected with other tables and graphs in pages.
Click the diagram to place the financial table.
The financial table will appear, and the table properties will appear in the Properties panel.
Use the properties panel to define one or more pages in the table.
Use the Table Settings tab of the Properties panel to define your financial table.
Click the financial table to show the Properties panel. Click the Settings tab (![]() ) if it's not selected.
) if it's not selected.
Enter information about the table as described below.
Add items to the table. Click the
The item name will change to the name of the selected variable, and the table will be populated.
To delete a table item or page:
By default, financial tables use the format and precision settings of the variables displayed. To change these, go to the Scales and Ranges tab of the properties panel for the variable of interest. You can also override these settings for a table.
Note: The selections you make on the table for precision, units, and scaling affect the display of the variable in the table only.
In the table, right-click, then select Format from the menu that appears. Then select Multiple, the name of the variable you want to change, or Time.
If you select Multiple the Format Numbers dialog box will open.
If you select a specific variable the Format Variable dialog box will open.
If you select time, a list of the Time Labels defined for this model will appear. To add a time label see Manage Time Labels dialog box
By default, tables adjust column width to fit the contents. You can also specify the width of columns.
Note: You can copy the output from a financial table into a word processor document or a spreadsheet. You can also export data. For more information, see Importing and Exporting Data.
You can reorder pages by clicking on ![]() and rearranging the sequence in the Reorder Pages
and rearranging the sequence in the Reorder Pages
Once you add more than one page you will also see an icon ![]() to edit multiple pages in the collection (collections mixing graphs and tables do not have common elements to edit). See Pages Styles (Interface)for more discussion of the pages.
to edit multiple pages in the collection (collections mixing graphs and tables do not have common elements to edit). See Pages Styles (Interface)for more discussion of the pages.
Title is the text that will be displayed across the title bar of the table.
Header Label is the text that will be shown in the first column of the first row. The text for the remaining columns will be based on the time labels associated with each column (using the default time label as set in the Manage Time Labels dialog box).
Number of Periods sets the maximum number of periods data will be displayed for (maximum number of columns with values). Only the number of periods for which data are available will be displayed, but if there are more of these than the number of period specified the earlier periods will be skipped. Leave blank to show all periods for which data are available.
Reporting Interval is the number of time units in each period. With a model in months, 1 would be monthly, 3 quarterly and 12 annually. Typically, this will be a number large than one, though values such as 0.25 are allowed.
Mark for Export, if checked, will allow you to include the financial table when exporting results (see Export Data dialog box). Note that financial tables will always be exported with the same content and formatting of numbers as is shown on the screen.
Show initial values for stocks, if checked, will display the initial values of stocks (and converters marked report as stock). This can be helpful when the display of initial conditions is important.
You can set formatting options for each row of a financial table. The exiting entries are lists, and you can drag to reorder them, or click on one to set options specific to that entry. The currently highlighted entry is the one you are setting options for.
![]() adds a new row. The Find dialog will open so you can select a variable.
adds a new row. The Find dialog will open so you can select a variable.
![]() removes the highlighted row.
removes the highlighted row.
Add Blank adds a blank row.
Type is either Values or Blank. Use Blank to create spacing in the table. A Blank row can have text that will appear in the first column, but the remaining columns will be blank.
Variable is the model variable to be displayed. You can type or use the ![]() button to change this. This is not available for blank lines.
button to change this. This is not available for blank lines.
Run is the run the values will be displayed for. This is typically the current run, though it is possible to show values from other runs for comparison purposes. This is not available for blank lines.
Row Label is the text that will be shown in the leftmost column. If this is left blank for a variable the variable name will be used, for a blank line nothing will appear.
Number Formatting lets you specify how number will be formatted for the currently selected row. This will open the Format Variable dialog box.
Separator Style allows you to introduce a dividing line at the bottom of the row.

Select Solid to see the line. the line will extend to the final column for which values are displayed. Select None to have no line. The line will be drawn for all rows, including blank rows with no label.
Separator Thickness determines the thickness of the displayed line. This has an effect only if the Border Style of Solid has been selected.
Separator Color determines the color of the displayed line. This has an effect only if the Border Style of Solid has been selected. Click on the button to select a color.
Font Family, Size and Color allows you to set the font for the row (both the name and values). The font for the header row is set from the styles (![]() ) tab.
) tab.
Indented, if checked, will cause the label for the row to be indented. This allows you to call out subitems in the table more easily.
Report As specifies how you want reporting to occur for the variable.
Flow will accumulate values for the flow though the time period preceding that which is reported. This is the same as an income item in a financial statement.
Stock will report values that close the reported time period (this is actually the value at the beginning of the time period that follows). This is the same as a balance sheet item in a financial statement.
Instantaneous will report the value at the last time included in the time period being reported. This is a hybrid between stock and flow meant to approximate an ending value.
For example if the model is annual with a DT of 1/4 then at 2020 the flow values from 2020.0, 2020.25, 2020.5 and 2020.75 will be added up and multiplied by 0.25 (this is the accumulated flow for 2020). The stock value from 2021.0 will be reported (this is where 2020 ended). The instantaneous value will report the last value from the 2020 period, which is 2020.75.
If you want to treat a converter as an accumulation, then select flow. If you want to see the value of the converter at the same time as the stock (for example if the converter is a sum of stocks) select stock.
Normally you would not change the settings for flows or stocks, but you can if you choose.
Much of the styling in a financial table is done row by row. You can also set the header font and the column widths.
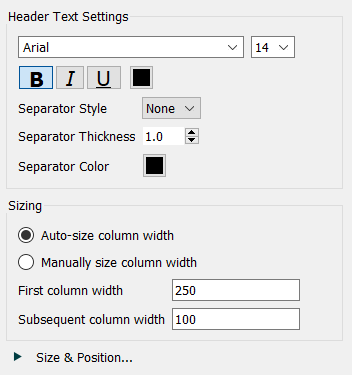
Header Text Settings lets you set the font that will be used in the header row. Select a face, size and attributes. You can also set the separator style, thickness and color that will be used just as for each row. The separator in this case will divide the header row from the rest of the table. Note that the header row does not scroll, so having a visible separator can be helpful.
Sizing lets you control the way that the first and subsequent columns are sized.
Auto-size column width will make the columns wide enough to accommodate the text they contain. This should give the minimum sized output with no cutoff of any text.
Manually size column width lets you set the first and subsequent column widths.
First column width sets the width of the first (label) column in pixels.
Subsequent column width sets the width on the remaining columns. Typically this will be smaller than the first.
Size and position sets the size and position as described in Styles Tab.